PASS THE OSAI CERT, Recon Part 1: Mapping the AI Attack Surface
Before you can attack an AI system you have to understand what it's made of. This module covers the anatomy of an AI-enabled stack and a taxonomy to organize everything you enumerate.
Reconnaissance is the part of an AI engagement that people skip and then regret. You can’t prompt-inject a model you haven’t found, and you can’t reason about a RAG pipeline you didn’t know was there. Every exploitation technique in the rest of this series assumes you already know what you’re pointing it at. This module is about building that picture, and this first post is the map you’ll organize the rest of the work around.
We’re going to do two things here. First, take an AI-enabled application apart into its real components so the words “the AI system” stop being a black box. Second, turn that anatomy into a recon taxonomy: for each layer, what you want to learn, and whether you’ll learn it passively or actively.
Why AI targets need their own recon
A traditional web app has a shape you already know: a server, some routes, a database, maybe a cache. An AI-enabled app has all of that plus a second stack bolted on that most pentesters have never had to enumerate. There’s a model somewhere (maybe an API you’re paying a third party for, maybe weights running on a GPU box you can reach). There’s usually an orchestration layer gluing the model to your data and tools. There’s often a retrieval system pulling documents into the prompt. And there are frequently guardrails trying to sit between all of it and the attacker.
Each of those is a component with its own version, its own default ports, its own tells, and its own failure modes. Recon is how you find out which ones are present and which specific software is running, because “it’s an LLM app” and “it’s a LangChain agent calling GPT-4o with a Qdrant vector store and no output filter” are very different engagements.
The anatomy of an AI-enabled system
Here’s the shape of a typical retrieval-augmented, tool-using LLM application. Not every target has every layer, and part of recon is figuring out which ones are there.
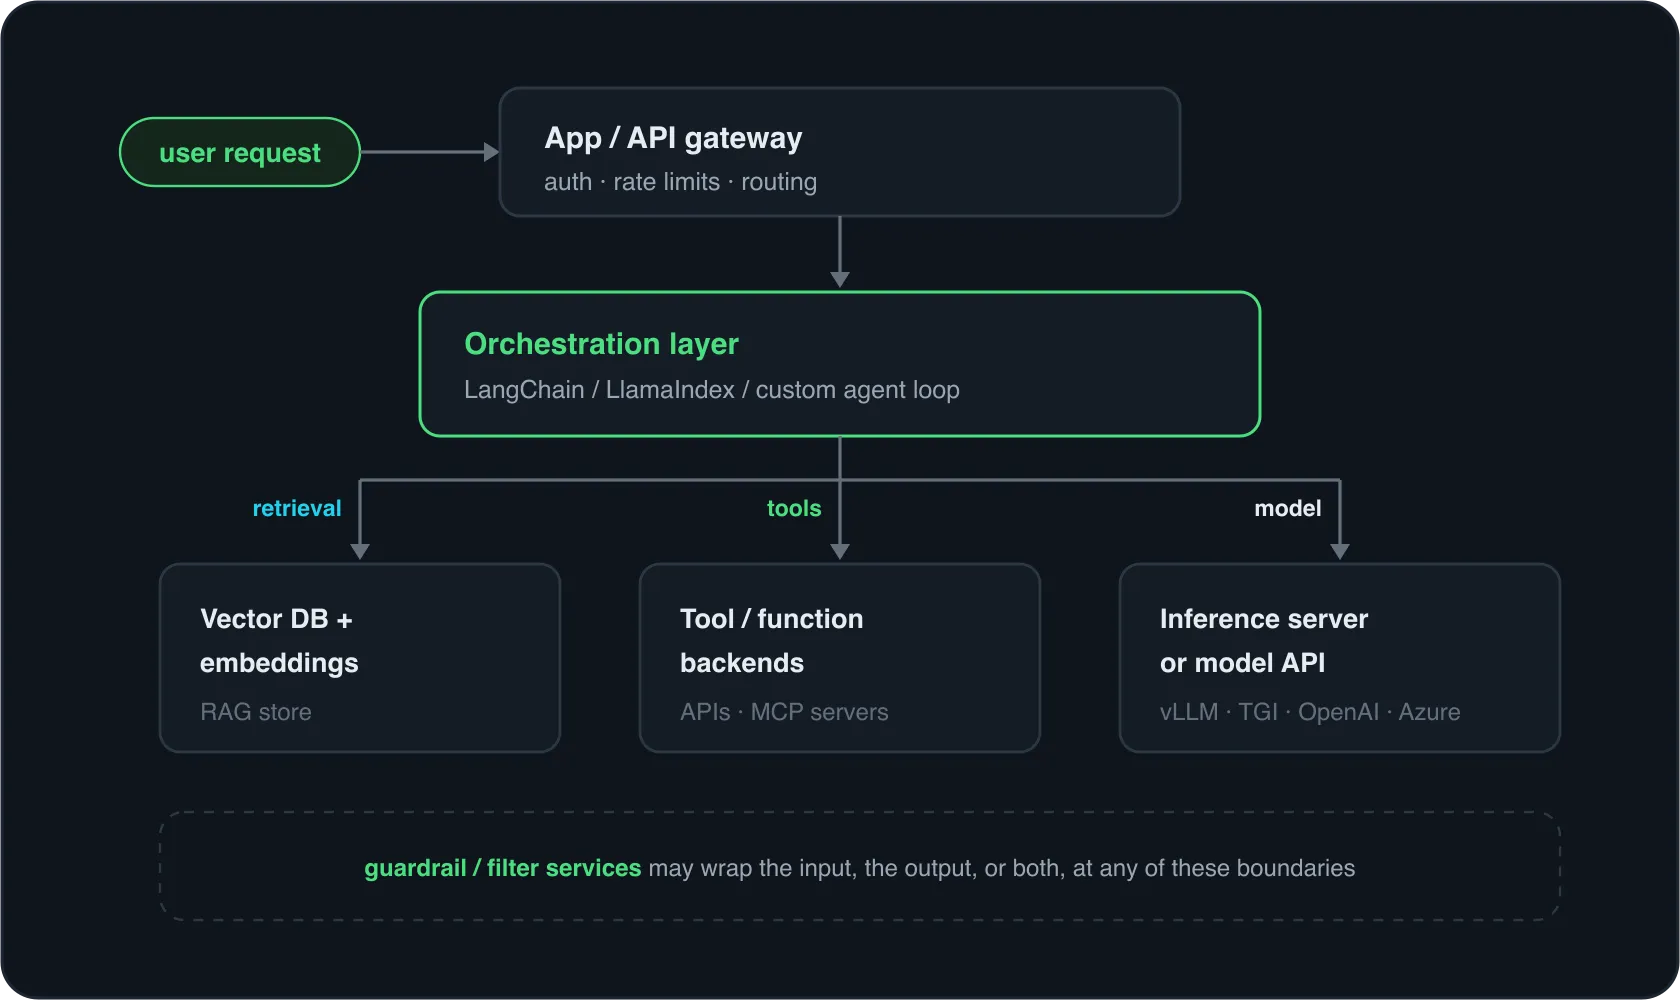
Let’s walk it component by component.
The gateway and observability. The ordinary web plumbing around all of this:
the API gateway (nginx, Kong, Envoy, or a cloud API gateway) doing auth (API keys,
OAuth, JWT) and rate limiting, usually proxying an OpenAI-style
/v1/chat/completions endpoint and streaming tokens back as server-sent events.
Alongside it sits observability tooling
(Langfuse, Helicone, LangSmith, OpenLLMetry) that captures traces,
token counts, and latency, and sometimes exposes its own dashboards and,
occasionally, whole conversation logs. An unauthenticated Langfuse instance on its
default port is a recon jackpot: it hands you prompts, tool calls, and model names
for free.
The orchestration layer. The glue that decides what goes into the prompt, when
to retrieve, when to call a tool, and how to loop. LangChain, LlamaIndex,
Semantic Kernel, Haystack, or a homegrown agent loop. You rarely see this
directly, but it leaves fingerprints: ReAct-style prompt scaffolding (Thought: /
Action: / Observation:), framework error strings in stack traces
(langchain_core, llama_index), dependency manifests in leaked code
(requirements.txt, package.json), and the characteristic multi-step latency of
an agent that reasons, retrieves, and calls tools before it answers.
The retrieval / RAG store. If the app answers questions about the target’s own
documents, there’s a retrieval system built on a vector database: Pinecone
(managed, no port to scan), Weaviate (8080 / 50051), Qdrant
(6333 / 6334), Milvus (19530), Chroma (8000), or
pgvector living inside a Postgres on 5432. It stores document chunks as
high-dimensional vectors and returns the top-k nearest neighbors (usually by
cosine similarity) for each query. This layer is where other people’s data lives,
which makes it a high-value recon (and later, poisoning) target. OWASP tracks this
class as LLM08:2025, Vector and Embedding Weaknesses.
The embeddings model. The function that turns text into the vectors the RAG
store indexes and queries. It might be a hosted endpoint (OpenAI
text-embedding-3-small/-large, Cohere embed) or an open model run locally
(BGE, E5, sentence-transformers). The vector dimensionality is a tell:
1536 for text-embedding-3-small, 3072 for -large, 768/1024 for most BGE/E5
variants. Treat that as a narrowing signal, not an identification: OpenAI’s v3
models accept a dimensions parameter that truncates the vector (Matryoshka), so a
1024-dim vector might be a shortened text-embedding-3-large rather than a BGE or E5
model. Query and document embeddings still have to come from the same model, so
identifying one pins down the other half of the pipeline.
Tool / function-calling backends. Anything the model can invoke through a JSON-schema tool definition or an MCP (Model Context Protocol) server: a web-search API, a SQL query, a code executor, an email sender, an internal microservice. These are the difference between “the bot said something weird” and “the bot did something with your infrastructure.” A code tool is a candidate RCE sandbox, an HTTP tool a candidate SSRF pivot, so enumerating what tools exist, and what arguments they accept, is central.
The model. The thing generating text. Two big cases. A hosted API (OpenAI, Anthropic, Azure OpenAI, Google Vertex/Gemini, AWS Bedrock) where the target is paying a provider and you’re really enumerating which provider and which model, readable from response headers, error-body shape, and tokenizer quirks. Or self-hosted weights (Llama, Mistral, Qwen, DeepSeek) running on an inference server the target controls, which means there’s a GPU box somewhere with an open port you might reach directly.
The inference server. When weights are self-hosted, something serves them.
Common ones: vLLM (:8000, OpenAI-compatible, Prometheus /metrics) and
Hugging Face TGI (/info, /generate), both usually exposing an
OpenAI-compatible API; Ollama (:11434, /api/tags lists every pulled model);
Triton (8000 / 8001 / 8002); llama.cpp’s server.
Each has default ports and identifiable behavior, though note that vLLM, Chroma, and
Triton all default to port 8000, so a hit there is a hint, not an identification; the
response path (Part 3) is what tells them apart. Finding one of these directly is
often a bigger deal than finding the app, because these servers frequently ship
with weak or no authentication.
Guardrail / filter services. Input classifiers, output scanners, and “AI firewall” products (Lakera Guard, NeMo Guardrails, Llama Guard, Azure AI Content Safety, Prompt Security) that try to catch prompt injection, block PII and secret leaks, or filter toxic output. They can sit at any boundary: in front of the model, after it, or both. Detecting whether one is present, and where, is its own recon task. Added latency, canned refusal strings, and inconsistent blocking are the tells, and it matters because a guardrail changes every exploitation technique that follows.
Trace one request
It’s worth following a single request through that diagram, because the data flow is where the trust boundaries (and the bugs) live.
- The user’s message hits the gateway, which authenticates and rate-limits it.
- The orchestration layer takes over. It may rewrite the query, then send it to the embeddings model to get a vector.
- That vector queries the vector DB, which returns the most similar chunks of the target’s documents. Those chunks get pasted into the prompt as “context.”
- The orchestrator assembles the final prompt (system instructions + retrieved context + conversation + the user message) and sends it to the model.
- The model may respond with text, or with a request to call a tool. If it calls a tool, the result comes back and the loop runs again.
- The response may pass through an output guardrail before reaching the user.
Notice how many of those steps splice untrusted content (the user’s message, and retrieved documents that someone may have poisoned) into the same prompt as trusted instructions. That’s the structural weakness the whole field is built on, and recon is how you find out which of those steps actually exist in your target.
A recon taxonomy for AI targets
Now turn the anatomy into a checklist. For each layer, there’s something you want to learn, a way you might learn it without touching the target adversarially (passive), and a way you’d learn it by probing directly (active). This table is the spine of the next two posts: Part 2 covers the passive column, Part 3 covers the active one.
| Layer | What you want to learn | Passive signal | Active signal |
|---|---|---|---|
| Gateway / observability | Auth scheme, rate limits, exposed dashboards | OSINT, subdomains, exposed Langfuse/Helicone instances | Directory and endpoint enumeration, SSE probing |
| Orchestration | Which framework, agent or plain chat | Repo imports, prompt-formatting tells | Multi-step behavior, framework-specific error strings |
| RAG / vector DB | Is retrieval present, which store | Config leaks, infra-as-code | Vector-DB ports (6333, 8080, 19530), canary queries, citation behavior |
| Embeddings | Which embeddings model, vector dimension | Repo config, manifests | Inference from chunking, dimensionality, retrieval behavior |
| Tools | What the model can invoke, and with what args | Leaked tool/MCP definitions, source | Prompting the model to reveal or exercise tools |
| Model | Provider and exact model/version | Leaked config in repos, HTTP headers, error-body shape | /v1/models listing, tokenizer/behavioral fingerprinting |
| Inference server | Which server, which version, is it exposed | Dependency manifests, Docker layers | Port scan, /health, /metrics, /api/tags, server-specific paths |
| Guardrails | Present or not, where, how strict | Vendor mentions in repos/job posts | Probe-and-observe: what gets blocked, how, and with what latency |
Two habits make this taxonomy pay off. Fill in the passive column first, because it costs the target nothing to notice and often hands you the answers for free (Part 2). Then use active probing to confirm and complete the map (Part 3), spending your noisier interactions only on the gaps passive recon left open.
Where this is going
You now have the two things the rest of the module needs: a component model of what an AI target is actually made of, and a taxonomy that tells you what to look for at each layer. Part 2 works the passive column, pulling as much of this map as possible out of HTTP responses and public code before you ever send the target an adversarial request. Part 3 then goes active, discovering services, fingerprinting the model, and mapping the RAG pipeline directly.
Continue to Part 2: Passive Reconnaissance of AI Systems →
This is an independent study guide. DSEC Labs is not affiliated with or endorsed by OffSec. Only run these techniques against systems you are authorized to test. DSEC Labs does this work professionally as AI red teaming.