PASS THE OSAI CERT, Recon Part 3: Active Reconnaissance of AI Systems
The noisy half of recon: discovering AI services on the network, fingerprinting the backend model by behavior, and mapping a RAG pipeline with direct probes. The final part of the reconnaissance module.
Part 2 got you a map built from public artifacts and ordinary responses. Now you confirm and complete it by probing the target directly. This is active reconnaissance: it shows up in logs, it can trip alerts, and it’s how you turn “probably a self-hosted vLLM behind LangChain” into certainty.
A word before commands. Active recon touches the target in ways it can record. Only do this against systems you’re explicitly authorized to test, stay inside your rules of engagement, and remember that part of the skill (and part of what the OSAI exam values) is doing it without needlessly tripping every detection the target has. Probe deliberately, not by spraying everything at once.
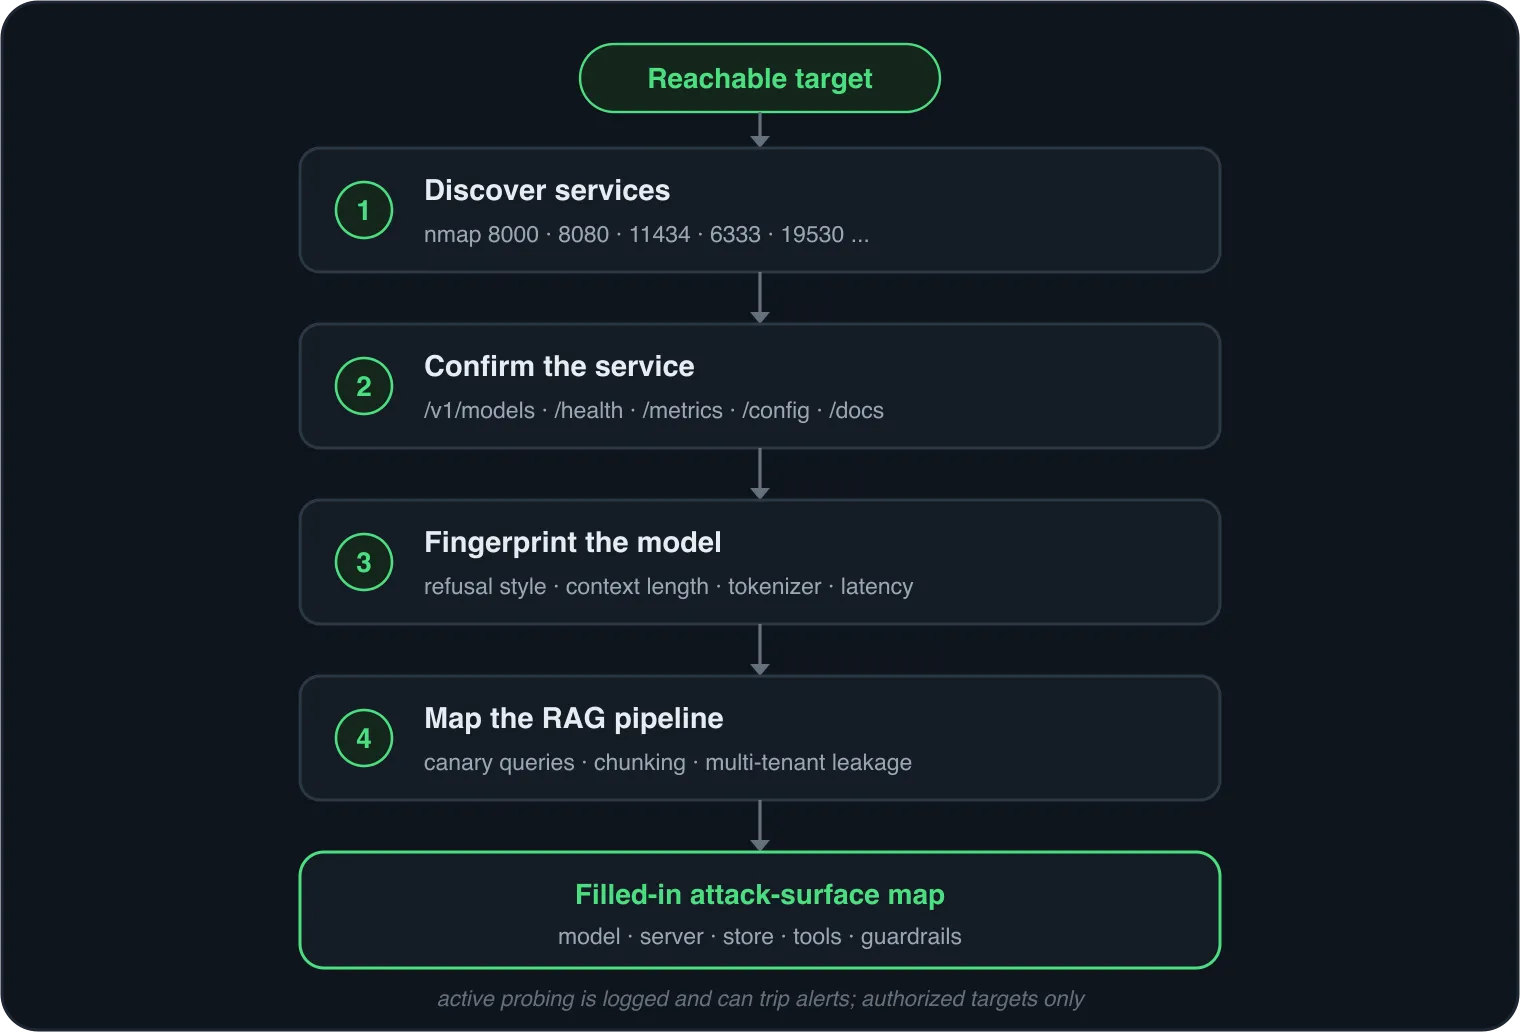
Discovering AI services and endpoints
If any part of the stack is self-hosted and reachable, it’s listening on a port. Model servers and vector databases ship with well-known defaults, so a targeted scan finds them fast.
# Targeted scan of the ports AI infra commonly listens on (a starter set, not exhaustive)
nmap -sV -p 5432,6333,6334,7860,8000,8001,8002,8080,8265,8501,8888,9091,11434,19530,50051 target.example
What tends to live where:
- Inference servers: vLLM on 8000, Hugging Face TGI on 8080, Ollama on 11434, Triton on 8000-8002, llama.cpp’s server on 8080. Many expose an OpenAI-compatible API.
- App/demo frameworks: Gradio on 7860, Streamlit on 8501, Jupyter on 8888 (a foothold in its own right if unauthenticated), the Ray dashboard on 8265.
- Vector databases: Qdrant on 6333 (HTTP) and 6334 (gRPC), Weaviate on 8080
(gRPC on 50051), Milvus on 19530 (metrics on 9091), Chroma on 8000, or
pgvectorliving inside a normal Postgres service on 5432.
Once a port answers, confirm what it is with a few HTTP probes. OpenAI-compatible servers respond to a predictable set of paths:
# List the models the server will serve (often unauthenticated on self-hosted setups)
curl -s http://target.example:8000/v1/models

# Health and metrics are frequently open and very talkative
curl -s http://target.example:8000/health
curl -s http://target.example:8000/metrics     # Prometheus text: model name, GPU, queue depth
Those are talkative enough to end the guessing. A vLLM /v1/models returns the
served model id outright, and /metrics names it again next to GPU and queue stats:
# GET /v1/models
{"object":"list","data":[{"id":"meta-llama/Llama-3.1-8B-Instruct","object":"model"}]}

# GET /metrics  (excerpt)
vllm:num_requests_running 3.0
vllm:gpu_cache_usage_perc{model_name="meta-llama/Llama-3.1-8B-Instruct"} 0.42
An Ollama box is even more direct: GET /api/tags lists every pulled model by name
and digest. Gradio apps expose /config, which dumps the entire UI definition (every
input, output, and wired function). For the app’s own HTTP
surface, fall back to ordinary content discovery:
# looking for /api, /v1, /chat, /admin, /docs, /openapi.json...
ffuf -u https://target.example/FUZZ -w wordlist.txt -mc 200,401,403
A reachable /docs or /openapi.json on a FastAPI backend hands you the full API
schema, which is the fastest possible route to a complete endpoint map.
Fingerprinting the model
Knowing there’s a model is not the same as knowing which one. Start with the cheap answer, then fall back to behavior.
The cheap answer is enumeration. If the server exposes /v1/models, it may just
tell you:
curl -s http://target.example:8000/v1/models | jq '.data[].id'When that’s locked down or the name is generic, fingerprint by behavior with benign probes. You’re not attacking the model, you’re reading its tells:
- Self-report, taken with salt. Asking “what model are you?” sometimes works and is often wrong or scripted, so treat it as a weak signal, not proof.
- Family-specific refusal style. Different model families refuse and hedge in recognizably different voices and formats. The wording and structure of a refusal is a fingerprint.
- Context-length behavior. Probe how much input it accepts before it errors or truncates. The cutoff points cluster around known context windows and help narrow the family and version.
- Tokenizer and special-token tells. Models react differently to unusual
Unicode, to their own special tokens, and to specific formatting. The most decisive
version is the chat template: when a server reflects or fumbles its formatting you
can read the family straight off the markers,
<|im_start|>for ChatML (Qwen, some GPT),[INST]and<<SYS>>for Llama 2 and Mistral,<|start_header_id|>for Llama 3, and<start_of_turn>/<end_of_turn>for Gemma. - Latency and throughput shape. A small self-hosted model on one GPU has a very different latency and tokens-per-second profile than a frontier hosted API. Timing is a coarse but real signal about self-hosted versus provider.
No single tell is conclusive. You stack several weak signals until GPT versus Claude versus Llama versus Mistral versus Gemini stops being ambiguous. While you’re here, watch for a guardrail layer: responses that get cut off, replaced with a canned refusal, or blocked at a suspiciously consistent boundary suggest an input or output filter sitting in front of the model, which is its own thing to enumerate.
Mapping the RAG pipeline
If the app answers questions about the target’s documents or other information, there’s retrieval behind it, and mapping that pipeline is often the highest-value recon you do, because it’s where other people’s data lives.
First, confirm retrieval is even happening. Signals that the model is being fed retrieved context rather than answering from training data alone:
- It cites or quotes specific documents, product details, or names it couldn’t plausibly know from pretraining.
- Answers change when you reference recent or niche internal topics, and latency jumps on those queries (the extra hop to the vector store and back).
- Ask about something clearly outside the likely knowledge base and watch it fall back to generic answers, versus something inside it and watch it get specific.
Then probe the shape of the pipeline:
- Confirm with canary queries. Ask for verbatim or near-verbatim recall of a distinctive internal phrase. Getting it back confirms retrieval and hints at chunk size (how much surrounding text comes with it).
- Infer chunking and overlap. How much context comes back around a matched phrase suggests the chunk size and overlap the ingestion pipeline used.
- Scope the knowledge base. Systematically ask across topics to map what the store does and doesn’t contain. The boundaries of its knowledge are the boundaries of the corpus.
- Probe for multi-tenant leakage. In a shared system, test whether you can pull back content that belongs to a different tenant or user. This is the recon step that most often turns into a finding on its own.
- Identify the orchestrator by behavior. Multi-step reasoning, tool calls narrated in the output, and characteristic prompt scaffolding all point at whether it’s a LangChain agent, a LlamaIndex query engine, or something custom, confirming what Part 2’s dependency-mining suggested.
Wrapping up: the recon workflow
Step back and look at the whole module as one loop.
- Understand the stack (Part 1). Build the component model and the taxonomy so everything you find has a place to go.
- Go passive (Part 2). Pull as much of that taxonomy as you can from HTTP responses and public code, silently.
- Go active (this post). Confirm and complete the map with service discovery, model fingerprinting, and RAG probing, spending your noisy interactions only on the gaps.
The deliverable is a filled-in attack-surface map: provider and model, inference server and version, orchestration framework, retrieval store and rough corpus scope, the tools the model can reach, and where (if anywhere) guardrails sit. A quick self-check before you call recon done:
- Do I know the exact model, or just that there’s “an LLM”?
- Do I know whether it’s self-hosted or a hosted API, and can I reach the server directly?
- Do I know whether retrieval is present, and which vector store?
- Have I enumerated the tools the model can call?
- Do I know whether a guardrail exists, and at which boundary?
Every “yes” is a technique in the next phase that you can aim precisely instead of blindly. That precision is the entire reason recon comes first, and it’s what turns the exploitation phase from guesswork into a plan.
That closes the Reconnaissance module. Head back to the series home for the other modules as they publish.
This is an independent study guide. DSEC Labs is not affiliated with or endorsed by OffSec. Only run these techniques against systems you are authorized to test. DSEC Labs does this work professionally as AI red teaming.